Chapter 5 R-Console
Die R-Console ist eine Kommandozeilen-Umgebung, in die R-Befehle eingegeben werden können. Sie ist die Standard-Benutzerschnittstelle einer R-Installation.
In R-Studio ist die R-Console auch verfügbar und als Voreinstellung im linken, unteren Quadranten zu finden. Die Console akzeptiert alle Befehle und versucht, sie als R-Befehle zu interpretieren und auszuführen. Die Ergebnisse der Ausführung werden direkt in der Console ausgegeben, dann wartet die Console auf weitere Eingaben.
Es gibt zahlreiche andere Möglichkeiten, R zu nutzen.
5.1 Notes and Examples - Hinweise und Beispiele
5.1.1 Stichpunkte
Konsole als interaktive Schnittstelle zu R
Kommandozeile (Cursor)
versucht, Eingaben als R-Befehle zu interpretieren
ein paar Beispiele simpler Mathe
Textzeilen mit Kommandos, die abgearbeitet werden (R-Programm wäre viele solcher Zeilen, s. u.)
Zeile zurückholen
Copy und Paste aus history in command line
copy-paste aus anderen Quellen möglich
Ergebnisse “laufen durch”
R kennt Objekte
R hat viele vordefinierte Objekte (z. B. pi)
Wir können Objekte definieren, indem wir einem Objekt einen Namen geben und ihm einen Inhalt zuweisen über
<-oder=Objekte werden im Environment gespeichert
Wir benutzen Objekte, indem wir ihren Namen gebrauchen
R kennt Funktionen (z. B. sqrt(), log(), exp() )
Wir erkennen Funktionen an den Klammern (brackets)
In den Klammern übergeben wir Argumente
geschachtelte R-Ausdrücke werden von innen nach außen aufgelöst
Mini statistics sum()
- B. Körpergrößen: 180, 176, 180, 182, 160, 156, 165, 160, 159, 189
sd(), var(), mean()
Objekte können ein oder mehrere Elemente enthalten
combine: c()
Daten-Objekt
Grafiken werden ebenfalls über Befehle erzeugt, wir programmieren Grafiken
Grafiken in eigenem Fenster, können aber über Befehle gespeichert werden oder per copy-paste in andere Dokumente integriert werden
Tabellen als Datenobjekte
data.frameErgebnisobjekte
5.1.2 Examples
Versuche und Demos
# a first impression on R using the console and some very basic concepts
# objects, functions, data objects, descriptive stats and a first impression on graphs
version
## _
## platform x86_64-apple-darwin17.0
## arch x86_64
## os darwin17.0
## system x86_64, darwin17.0
## status
## major 4
## minor 1.3
## year 2022
## month 03
## day 10
## svn rev 81868
## language R
## version.string R version 4.1.3 (2022-03-10)
## nickname One Push-Up## [1] 85## [1] 18## [1] 20000# simple objects: containers with a name
# f. e. number pi
# objects show their content in the console, if we call them by name
pi## [1] 3.141593## [1] 9.869604## [1] 9.869604# we can create our own objects by assigning something to a name using "=" or "<-"
ss = "Paul who made the highscore recently" # we create an object that contains a string
aa = 3948527349584259827 # the content of aa is a large number
rr <- sqrt(9) # rr stores the result of a function call
# we can use objects by calling/using the name
ss # shows the string contained## [1] "Paul who made the highscore recently"## [1] 3.948527e+18# functions, are objects that have parameters in brackets
# a lot of them are predefined in R base or in packages, but we can define our own functions also
# parameters depend on the function in question, some might not even need any: empty brackets ()
getwd() # returns the current working directory## [1] "/Users/pzezula/ownCloud/lehre_ss_2022/unit/b_environment/r-console"## [1] "2022-04-21 15:20:48 CEST"# Sys.getenv() would return all system variables, to get a specific one we ask for it
Sys.getenv("PATH")## [1] "/usr/bin:/bin:/usr/sbin:/sbin:/usr/local/bin:/Library/TeX/texbin:/opt/X11/bin:/Applications/RStudio.app/Contents/MacOS/postback"## [1] 3## [1] 2.302585## [1] 1## [1] 0.841471# we may use nested expressions in R
# the argument can itself be function, so the inner functions result is passed to the outer function
rr <- sqrt(3 * 3 * 9)
sqrt(rr)## [1] 3## [1] 0.14112## [1] 1.151563## [1] 3## [1] 0# we can store the result of our nested expressions in an object,
# as we can store anything in an object and use it by calling it's name
# we use a name of an existing object (rr) and therefore it is overwritten with the result of our nested expression
rr <- exp(sin(sqrt(rr)))
# using basic statistics
# f. e. if we have some body heights 180, 176, 180, 182, 160, 156, 165, 160, 159, 189
# sum works
sum(180, 176, 180, 182, 160, 156, 165, 160, 159, 189) # sum of our collected heights## [1] 1707mean(180, 176, 180, 182, 160, 156, 165, 160, 159, 189) # idea: arithmetic mean, average height, doesn't work, why?## [1] 180# mean accepts only one unnamed parameter
# we better store our body heights in an object and use this instead
# heights <- 180, 176, 180, 182, 160, 156, 165, 160, 159, 189 would not work, we have to convert our values to a unit (vector) by using c()
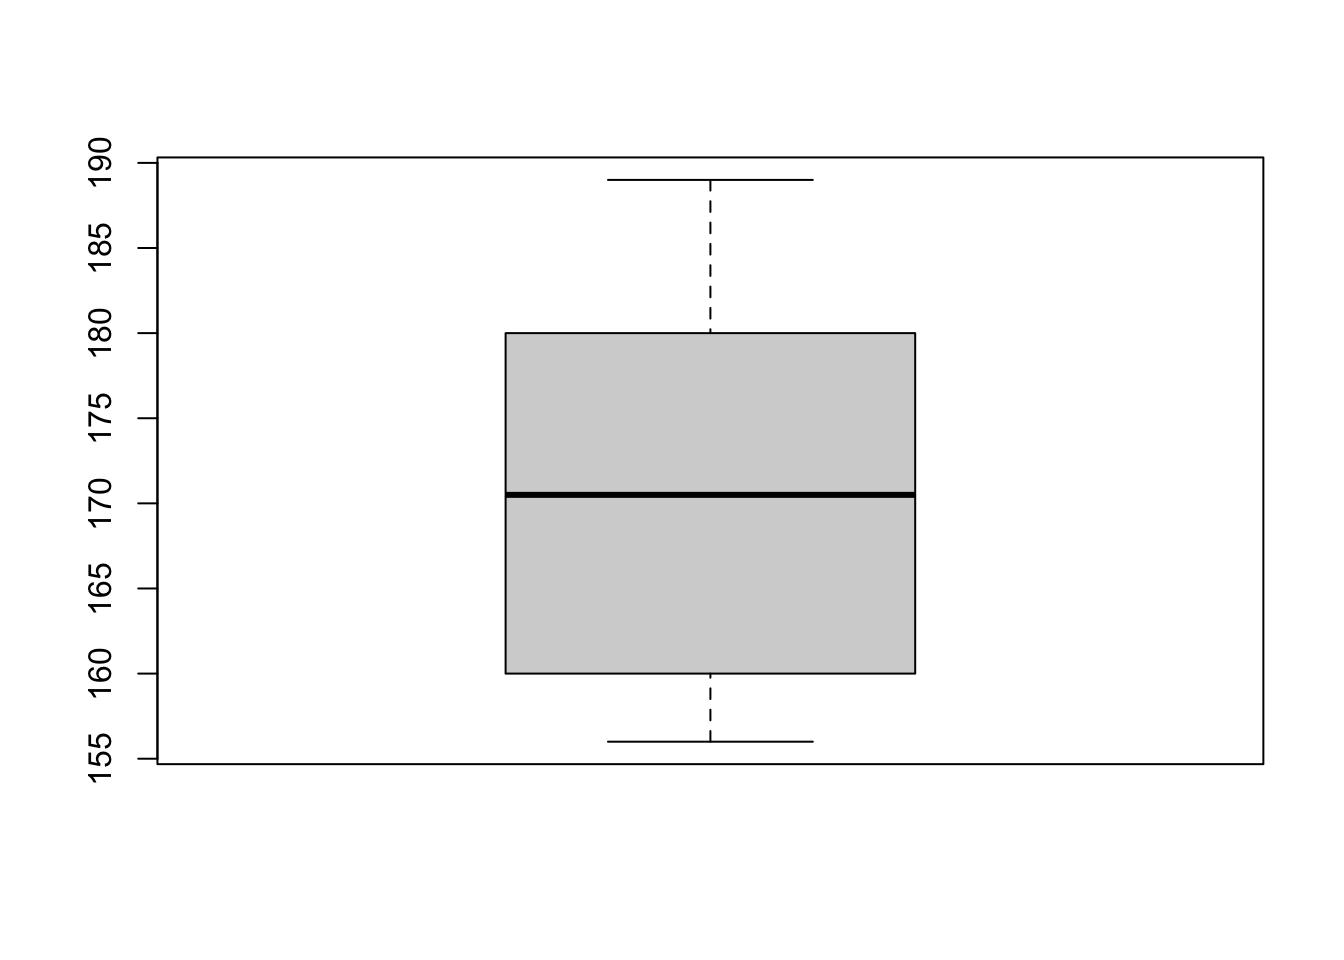
heights <- c(180, 176, 180, 182, 160, 156, 165, 160, 159, 189)
# heights is a data object
# as with any other object we can access our data by using the name of the data object instead of using the values directly
mean(heights)## [1] 170.7## [1] 11.91684## [1] 1707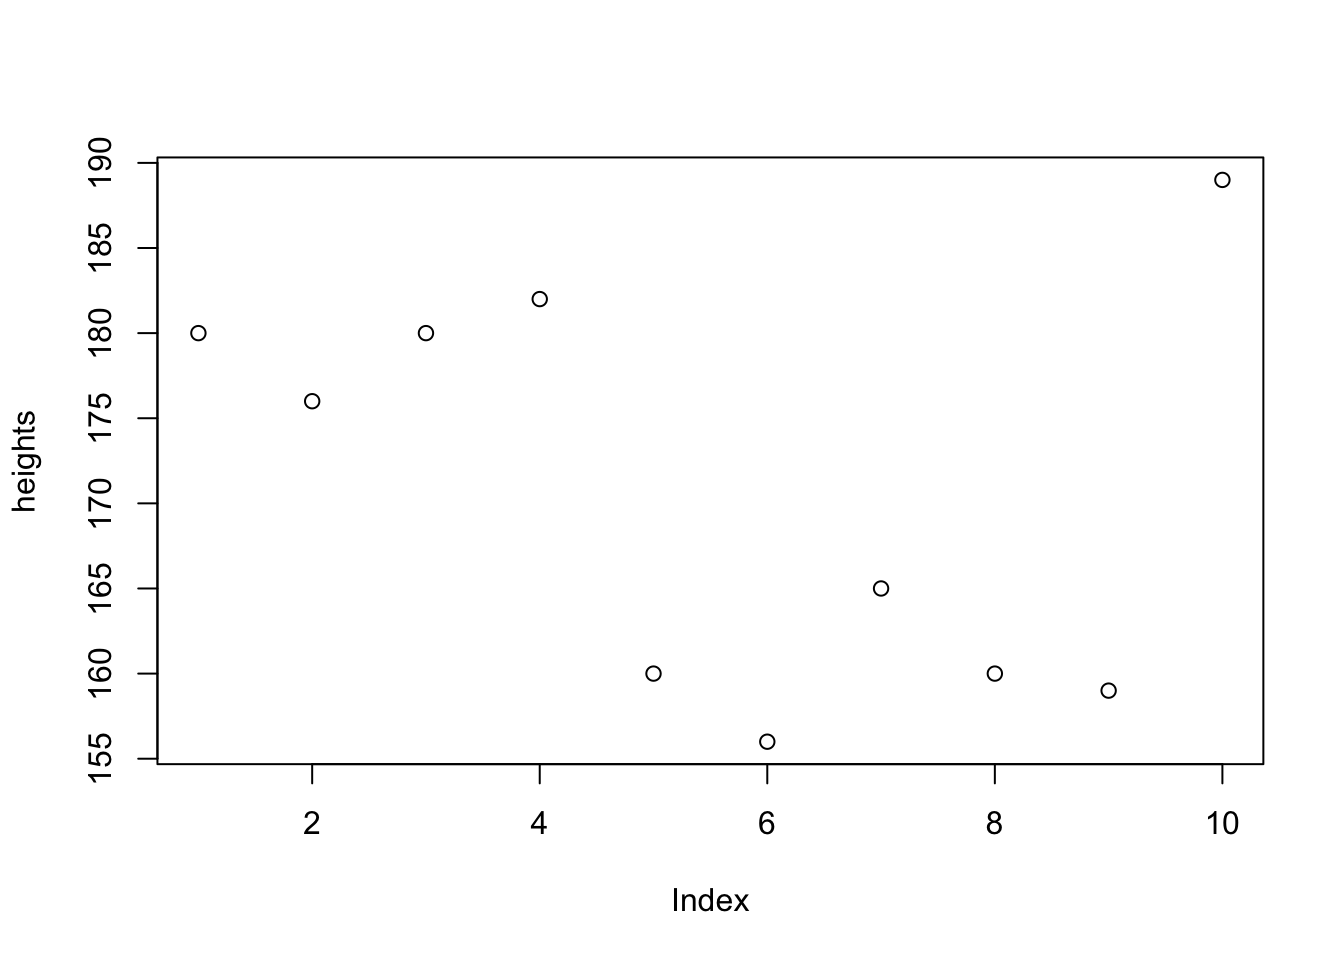
# imagine we also collected weights of the same observations
weights = c(60, 54, 110, 52, 62, 41, 71, 70, 44, 60)
length(weights) # number of values included
## [1] 10## [1] 62.4# now, we have two sources of data for the same people
# R can have multiple sources of data at a time
# so we could compare them f. e.
mean(heights) > mean(weights)## [1] TRUE# ... which is hopefully TRUE ;-)
# of course, R also knows data tables (vars in columns, observations in lines)
# they are called data frames in R base
# a first glance
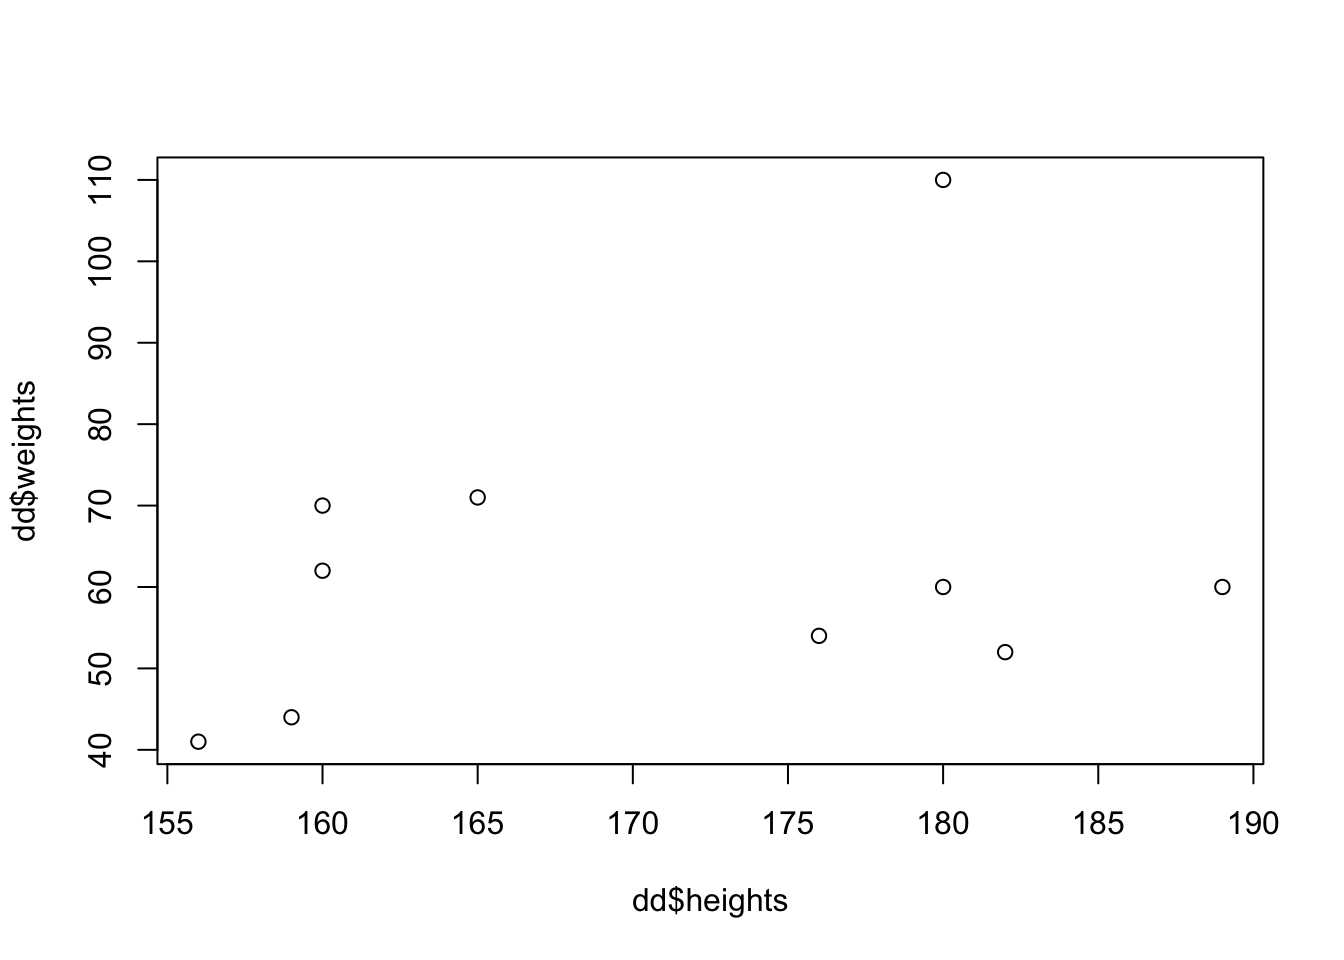
dd <- data.frame(heights, weights)
# show our data table
dd## heights weights
## 1 180 60
## 2 176 54
## 3 180 110
## 4 182 52
## 5 160 62
## 6 156 41
## 7 165 71
## 8 160 70
## 9 159 44
## 10 189 60## [1] 60 54 110 52 62 41 71 70 44 60## [1] 170.7# dd is also an object in R
# you can see it in the Environment in R-Studio
# you can also check its structure there by clicking on the little blue arrow in front of the name
# we can use multiple data objects in one plot
plot(heights, weights)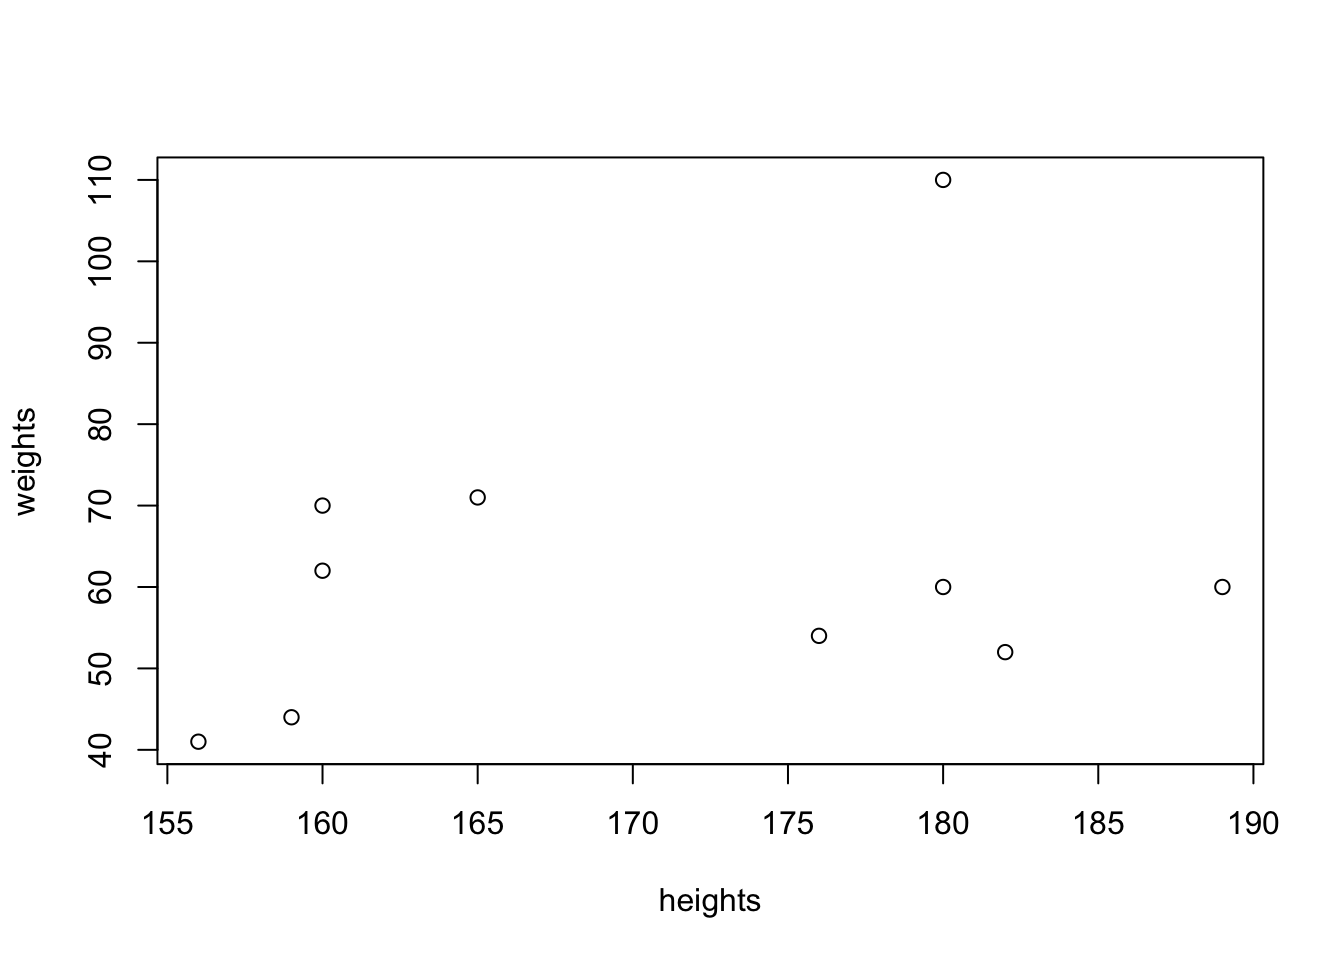
# we might play around with some more data and columns
ht     <- c(  180,   176,   180,   182,   160,   156,   165,   160,   159,   189)
wt     <- c(   60,    54,   110,    52,    62,    41,    71,    70,    44,    60)
gender <- c(  "m",   "m",   "f",   "f",   "f",   "f",   "f",   "f",   "f",   "m")
group  <- c(    1,     1,     1,     1,     1,     2,     2,     2,     2,     2)


dd <- data.frame(ht, wt, gender, group)
5.2 Aufgaben / Exercises
- rechnen Sie mit der Konsole
- definieren Sie Objekte verschiedenen Typs
- überschreiben Sie Objekte und überprüfen Sie, was Sie getan haben
- experimentieren Sie mit Funktionen
- suchen Sie sich für Sie neue R-Funktionen und experimentieren Sie damit
hierbei sind sog. Cheat-Sheets nützlich: Sie finden einige davon unter
Helpim R-Studio Menu, Websuchen helfen natürlich auch - machen Sie geschachtelte Ausdrücke in R
- suchen Sie sich R-Code im Web, z. B. aus Tutorials, es gibt viele davon, und fügen ihn in die Konsole ein
- machen Sie Versuche mit einfachen Statistikfunktionen
- experimentieren Sie mit Daten-Arrays und Data-Frames
- experimentieren Sie …